Latest Market Overview 20th Dec: BTC, ETH, BNB, XRP, SOL, ADA, DOGE, AVAX, DOT, LINK

The price of Bitcoin (BTC) has once again surged towards its previous high, with many other alternative cryptocurrencies (altcoins) also reaching new year-to-date peaks.
There is considerable excitement in the cryptocurrency markets regarding the potential approval of a spot Bitcoin exchange-traded fund (ETF) in January. Analysts at K33 Research, in a report dated Dec. 19, have suggested that recent ETF-related updates from BlackRock and ARK Invest involving a cash-creation mechanism for their funds strongly indicate that approval for a Bitcoin ETF is highly likely in January.
Michael Saylor, co-founder of MicroStrategy, shared with Bloomberg his belief that approving a spot Bitcoin ETF could be the most significant development on Wall Street in three decades. Combined with the Bitcoin halving event scheduled for April, these developments are expected to set the stage for a substantial bullish trend in the cryptocurrency asset class throughout 2024.
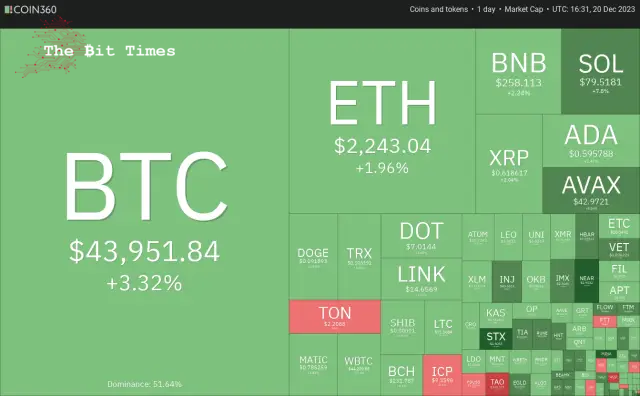
Continuing the bullish narrative, Grayscale CEO Michael Sonnenshein said in a CNBC interview that the spot Bitcoin ETF will open the market to “about $30 trillion worth of advised wealth.”
Will Bitcoin and altcoins break above their recent local highs, or will higher levels attract sellers? Let’s analyze the charts of the top 10 cryptocurrencies to find out.
Bitcoin (BTC) price analysis
Bitcoin dipped below the 20-day exponential moving average ($41,760) on Dec. 18, but the bears could not sustain the lower levels, indicating strong buying on dips.
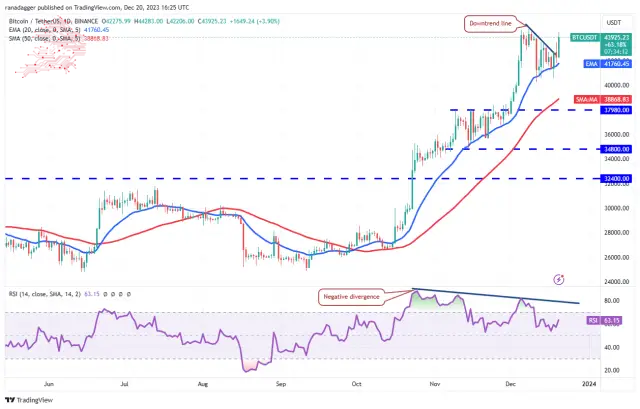
The bulls pushed the price above the downtrend line on Dec. 19, but the bears sold at higher levels. However, renewed buying on Dec. 20 has pushed the price above the immediate resistance at $43,500. This increases the likelihood of a rally above the 52-week high at $44,700. If that happens, the BTC/USDT pair could surge to $48,000 and eventually to $50,000.
Contrarily, if the price turns down sharply from $44,700, it will suggest that the sellers remain active at higher levels. The bears must sustain the price below the 20-day EMA to accelerate selling and challenge the solid support at $37,980.
Ether (ETH) price analysis
Ether has been witnessing a tough battle between the bulls and the bears near the strong support at $2,200.
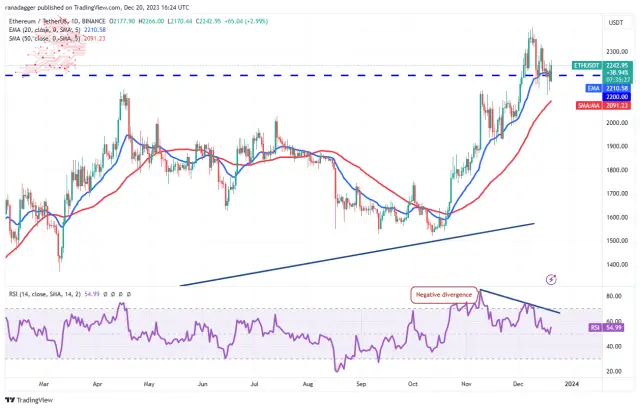
The failure of the bears to sustain the price below $2,200 indicates buying at lower levels. The flattish 20-day EMA ($2,210) and the RSI near the midpoint suggest a range-bound action in the near term.
Buyers will try to push the ETH/USDT pair to $2,332 and then to $2,403. Sellers are expected to defend this zone with vigour. On the downside, the 50-day SMA ($2,091) remains critical to watch. A break below it may result in a fall to $1,900.
BNB price analysis
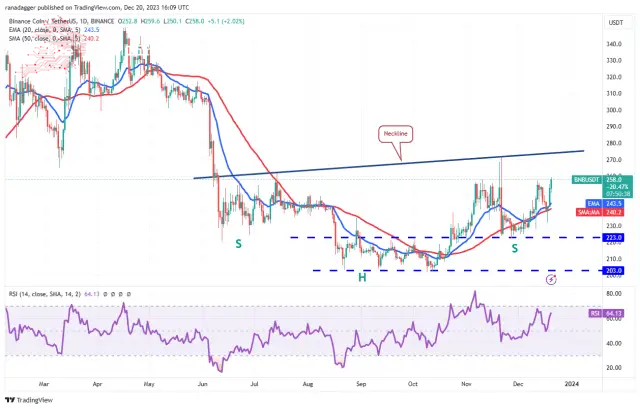
The upsloping moving averages and the RSI in the positive zone indicate that bulls have the edge. If buyers sustain the price above $260, the BNB/USDT pair could rally to the neckline of the inverse head-and-shoulders pattern. A break and close above the neckline will complete the bullish setup, having a pattern target of $333.
The immediate support on the downside is at the moving average and below $223. A drop below this level may sink the pair to $203.
XRP price analysis
The bulls purchased the dip in XRP near the strong support of $0.56 on Dec. 18, as seen from the long tail on the candlestick.
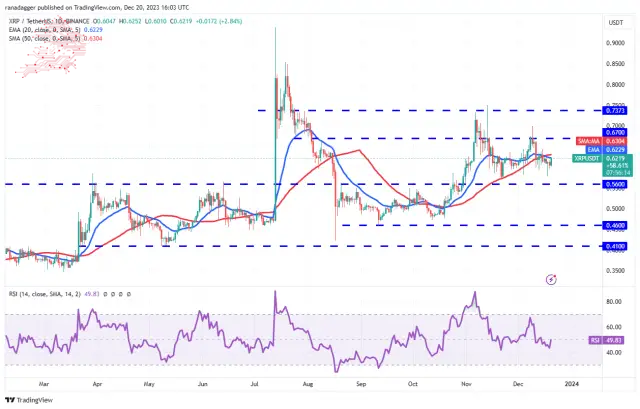
The bulls will try to drive the price above the moving averages. If they do that, the XRP/USDT pair could rise to $0.67, where the bears will try to defend the level vigorously. If the price drops from $0.67, the range-bound action may continue for a few more days.
On the contrary, if the price turns down sharply from the 20-day EMA, it will signal that the bears are trying to take charge. A drop below the crucial support of $0.56 could open the downside to $0.46.
Solana (SOL) price analysis
Solana is in a strong uptrend. The bulls purchased the dip to the 20-day EMA ($69.77) on Dec. 18, pushing the price above the resistance at $79.50.
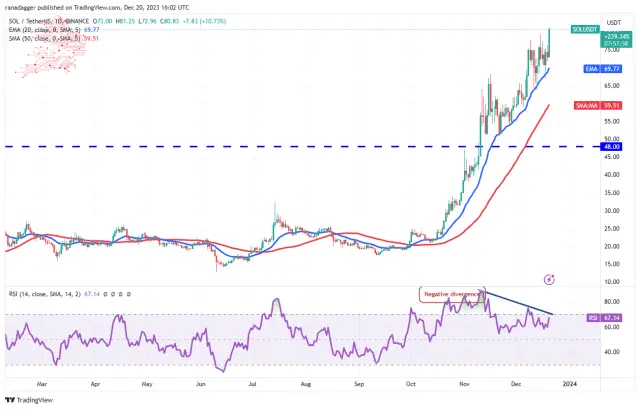
Although the upsloping moving averages indicate an advantage to buyers, the negative divergence on the RSI warrants caution. The bears will have to yank the price below the 20-day EMA to trigger stops of several traders, pulling the pair down to the 50-day SMA ($59.51) and subsequently to $50.
Conversely, if buyers sustain the price above $80, the SOL/USDT pair could start the next leg of the rally to $100.
Cardano (ADA) price analysis
Cardano turned up from the 20-day EMA ($0.54) on Dec. 18, as seen from the long tail on the candlestick.
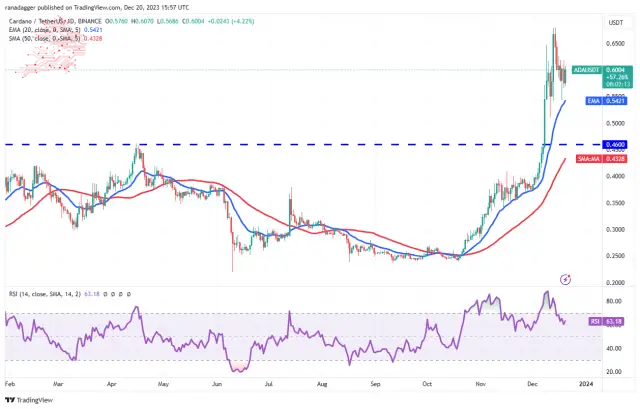
The bulls must overcome the minor barrier at $0.62 to challenge the 52-week high at $0.68. This level is likely to act as a stiff resistance, but if buyers kick the price above it, the ADA/USDT pair could attempt a rally to $0.78.
Bears must quickly drag the price below the 20-day EMA if they want to prevent the upside move. If they do that, the pair could plummet to the breakout level of $0.46, likely attracting buyers.
Dogecoin (DOGE) price analysis
The bulls are not allowing Dogecoin’s price to maintain below the 20-day EMA ($0.09), indicating solid buying at lower levels.
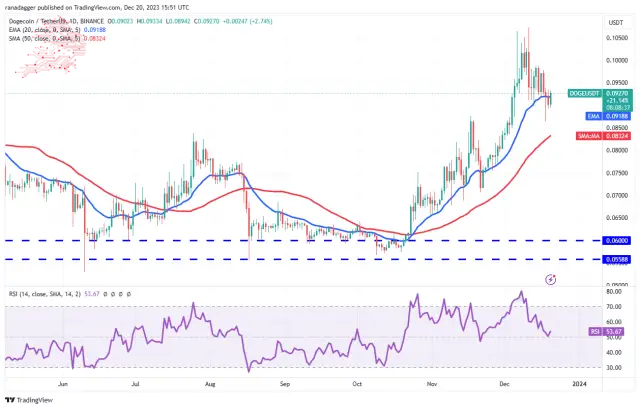
The 20-day EMA has flattened out, and the RSI is near the midpoint, suggesting a range-bound action in the near term. The DOGE/USDT pair may swing between the 50-day SMA ($0.08) and $0.11.
Buyers must propel the price above $0.11 if they want to seize control. That could start the next leg of the uptrend to $0.16. Alternatively, a drop below the 50-day SMA will suggest an advantage to bears, plunging the pair to $0.07.
Avalanche (AVAX) price analysis
Avalanche is attempting a rebound of $38, indicating that the bulls are trying to flip the level into support.

The rising 20-day EMA ($34.71) suggests an advantage to buyers, but the overbought levels on the RSI caution that consolidation or correction is possible in the near term. Sellers are expected to fiercely defend the overhead resistance at $45.33, but the next stop could be $50 if the hurdle is cleared.
The first sign of weakness will be a break and close below $38. That opens the door for a drop to the 20-day EMA. A break and close below the 20-day EMA will signal that the uptrend may have ended in the short term.
Polkadot (DOT) price analysis
Polkadot has been finding support at the 20-day EMA ($6.61), indicating that the bulls continue to buy the dips.
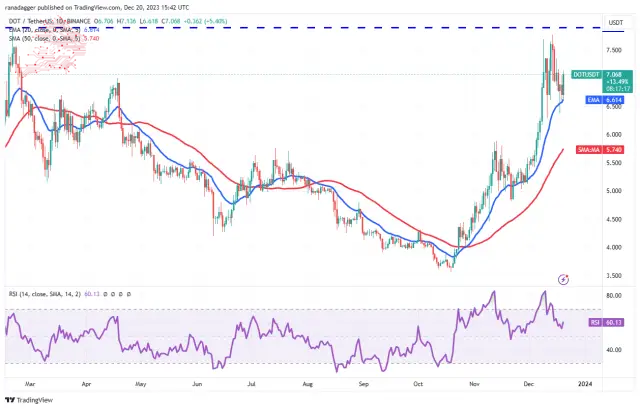
The bulls will try to push the price toward the overhead resistance at $7.90, where they will likely encounter strong selling by the bears. If buyers overcome the resistance, the DOT/USDT pair could increase momentum and rally to $10.
The bears are likely to have other plans. They will try to sell the rallies from the current level and tug the price below the 20-day EMA. If they do that, the selling could accelerate, and the pair may slump to the 50-day SMA ($5.74).
Chainlink (LINK) price analysis
For the past few days, Chainlink has been consolidating inside the extensive range between $12.85 and $16.60.

The moving averages are on the verge of a bearish crossover, and the RSI is just above the midpoint, indicating that the sellers have a slight edge. If the price sustains below the moving averages, the LINK/USDT pair could slide to the strong support at $12.85.
Contrarily, if the price rises above the 20-day EMA ($14.80), it will suggest that the bulls are trying to gain the upper hand. The pair may rise to $15.58 and later to $16.60. If the price turns down from this resistance, it will indicate that the pair may extend its range-bound action for some more time.
Comments
Post a Comment